
Most SEO conversations eventually narrow to one page. A client says "why isn't our services page ranking?" and you need a single screen that holds everything about that URL: its on-page setup, its issues, its real Search Console performance, and its speed. That screen is the Pages inspector.
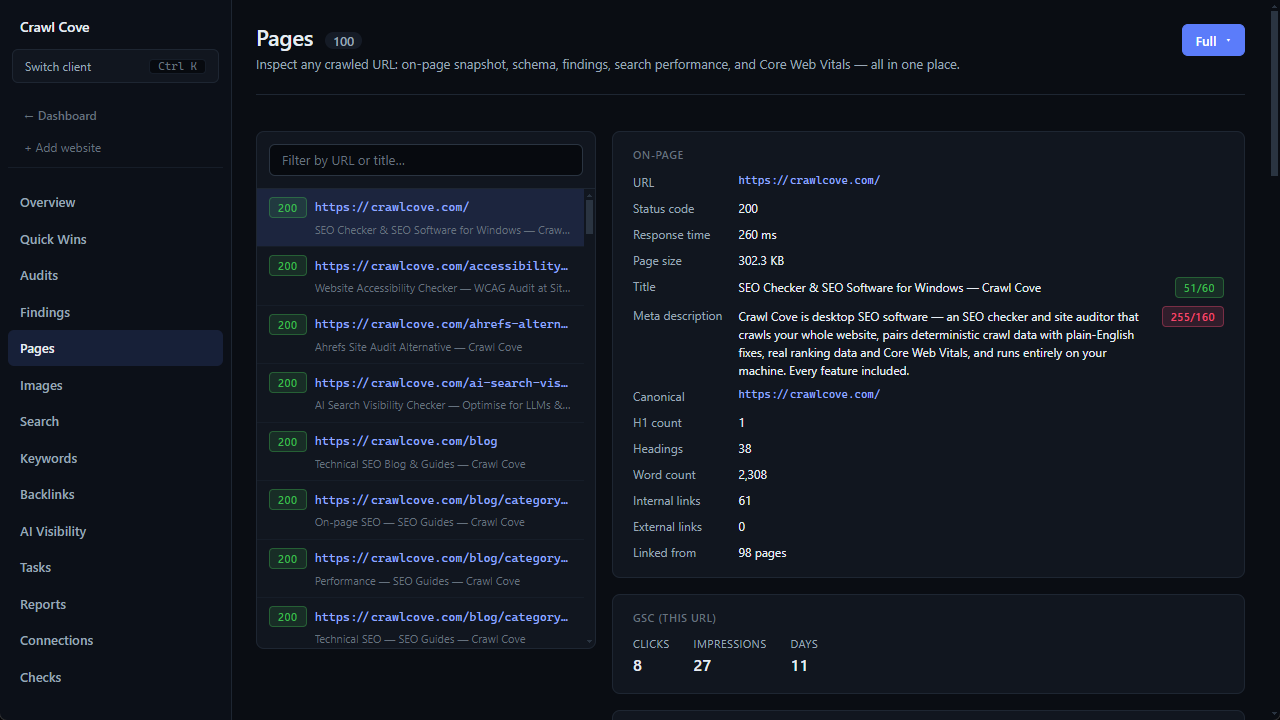
The Pages page is a searchable list of every URL the crawl found. Open one and you get the complete picture for that exact URL, in one place. It's built to be read aloud on a call without alt-tabbing between five tools.
Note
What you'll need: a completed audit. For the per-URL Search Console metrics and field Core Web Vitals you'll also want GSC connected and a CrUX API key, but everything else on the page works without them.
What you see per URL
The on-page essentials
For the selected URL the inspector shows the facts an audit turns on:
- Status code, title, meta description, H1s, word count, and the canonical.
These are the raw inputs behind most meta and content findings, laid out so you can confirm at a glance whether a title is missing, a canonical points somewhere odd, or a page is thinner than it should be.
Schema detected from the rendered DOM
The inspector reads structured data from the rendered DOM, not the raw HTML. This matters more than it sounds. Plenty of sites (WordPress especially) inject their JSON-LD via JavaScript, so it isn't in the source response. A tool that only reads raw HTML would report a false "no schema found." By checking the rendered DOM, Crawl Cove sees the schema that's actually there and avoids the false alarm.
Internal links and on-page findings
You also get the page's internal links (in and out) and every finding on that page, so the issues and their on-page context sit side by side. No cross-referencing the Findings Explorer to ask "what's wrong with this one"; it's all on the URL's own panel. A page with zero inbound links here is exactly what the Internal Link Checker flags across the whole site.
Real performance data for that URL
Search Console metrics and top queries
When GSC is connected, the inspector shows the Search Console metrics and top queries for that exact URL: what it's getting impressions and clicks for, and where it ranks. This is the heart of the "why isn't this page ranking?" conversation. You can see immediately whether the page is invisible (no impressions) or visible-but-not-clicked (impressions but near-zero clicks, which points to a title/meta problem), and which queries it's close on.
Core Web Vitals, two ways
The inspector gives you Core Web Vitals from both angles:
- Lighthouse lab: synthetic scores, run on demand via a button (never during a crawl). It drives a Chromium-family browser that is already on the machine: Google Chrome, Microsoft Edge, or the Playwright chromium if you happen to have one (Crawl Cove never installs it). With none of them the panel honestly reads "Lighthouse skipped — no supported browser found" and tells you to install Chrome or Edge and run the check again.
- CrUX field: real-user data from the Chrome UX Report, reflecting how the page actually performs for real visitors. Until the CrUX API key is set the panel reads "CrUX API key not set," and everything else on the page keeps working.
Lab tells you what could be slow in a controlled test; field tells you what is slow for real people. Having both on the URL's own screen is the difference between a guess and a diagnosis. See Core Web Vitals for setting these up.
The Run Switcher: inspect any past crawl
A Run Switcher at the top of the inspector lets you view this page as it was in any past crawl run, not just the latest. So you can show a client the same URL before and after a fix: the title that was missing two crawls ago and is there now, the word count that doubled, the finding that's gone. It's the per-page companion to the audit-level delta chips: proof, on one URL, that the work landed.
A note on live index status
The inspector can also run a live Google URL Inspection for the page: is it indexed, when was it last crawled, what's its coverage state. Because that calls Google on demand and is quota-bound, it's covered in its own guide rather than here.
Note
Live index status runs per URL on request (it's limited to roughly 2,000 inspections per day across your account), which is why it isn't part of the crawl. See Live index status for how it works and when to spend the quota.
Why agencies care
The Pages inspector is built for the client call. Instead of jumping between a crawler, Search Console, and a speed tool while someone waits, you open one URL and read the whole story: on-page setup, the issues, the real query data, the real-user speed, and the history. It turns "let me get back to you on that" into a live, evidence-backed answer.
Next
- Core Web Vitals: set up the Lighthouse lab and CrUX field panels you see in the inspector.
- Live index status: the quota-bound Google URL Inspection check, indexed?/coverage state, per URL on demand.
Want to answer "why isn't this page ranking?" on the next client call? See plans and get Crawl Cove →