
Key takeaways
- INP replaced First Input Delay as the responsiveness Core Web Vital in March 2024, and FID is now retired.
- INP measures interactions across the whole visit and reports a value close to the worst one, not just the first click.
- Every interaction has three phases (input delay, processing time, presentation delay) and you need to know which one dominates before you fix anything.
- A "good" INP is 200 milliseconds or less at the 75th percentile of real users, and only field data can measure it properly.
Interaction to Next Paint (INP) measures how quickly a page visibly responds when a real person clicks, taps or types. Of the three Core Web Vitals, it is the one most sites fail without realising it, because most testing happens on an empty page with nobody touching it. This is INP explained properly: how it replaced First Input Delay, the three phases that make up every interaction, what causes each one to stall, and exactly how to fix it. If you want the full picture of all three Core Web Vitals first, start with Core Web Vitals explained; this article goes deep on INP alone.
What is INP?
Interaction to Next Paint (INP) is the Core Web Vital that measures responsiveness: how long a page takes to visibly respond when someone clicks, taps or presses a key. It is measured in milliseconds, from the moment the browser registers the interaction to the moment the next frame is painted on screen, which is where the "next paint" in the name comes from. A good INP is 200 milliseconds or less at the 75th percentile of real visits; 200 to 500 milliseconds needs improvement, and anything above 500 milliseconds is poor.
INP joined Largest Contentful Paint and Cumulative Layout Shift as the third Core Web Vital in March 2024, taking First Input Delay's place. It differs from the other two in one way that catches people out: LCP measures loading and CLS measures visual stability, and both produce a reading on any page view. INP only produces one when somebody actually interacts. A page nobody clicks has no INP at all, which is exactly why so many sites fail it without knowing.
INP vs FID: what actually changed
For years, the responsiveness vital was First Input Delay (FID). FID measured one narrow thing: the time between a user's first interaction with a page and the moment the browser was able to start processing it. It ignored everything about how long that processing took, ignored how long it took the screen to visually update afterwards, and, critically, it only looked at the first interaction of the visit. A page could pass FID with flying colours on that first tap and then lock up for a full second on every scroll and click afterwards, and FID would never know.
In March 2024, Google replaced FID with INP as the official Core Web Vital for responsiveness, and FID was retired. INP fixes both gaps at once:
- It covers the whole visit. INP samples the interactions a user makes throughout their time on the page, not just the first one, and reports a value close to the worst of them (technically, close to the highest, with an allowance for very interaction-heavy sessions so a handful of outliers don't unfairly tank the score).
- It measures the full interaction, not just the delay before it starts. INP accounts for the time from input to the next visual frame the browser paints, which is the part users actually feel.
That second point is the one worth sitting with. FID answered "did the browser notice you clicked, promptly?" INP answers "did the page actually respond, in a way you could see, promptly?" Those are very different questions, and INP is the one that matches what a frustrated user means when they say a site "feels laggy."
Note
If you still see FID mentioned in an audit tool, a plugin, or an old article, treat it as out of date. FID has been fully retired from Core Web Vitals since March 2024; INP is the only responsiveness metric Google uses now.
The three phases (subparts) of every interaction
Every interaction INP measures (a click, a tap, a key press) passes through three distinct phases before the user sees a result. Google's own documentation calls these the three subparts of an interaction; subparts and phases are the same three things under two names, so if you have met the term "INP subparts" elsewhere, this is it. Knowing them matters because the fix for a slow phase-one problem is completely different from the fix for a slow phase-three problem, and guessing wastes time.
| Phase | What's happening | Typical culprit |
|---|---|---|
| Input delay | The browser has registered the interaction but the main thread is busy with something else, so it can't start handling it yet | A long task already running, often a third-party script or a big JS bundle parsing/executing |
| Processing time | Your event handler (and anything it triggers) actually runs | Expensive JavaScript in the handler itself: heavy state updates, synchronous calculations, large re-renders |
| Presentation delay | The browser calculates style, layout and paint, and gets the new frame on screen | Complex style recalculation, a huge DOM, or layout thrashing triggered by the handler |
Diagnosing which phase dominates is the first real step, not an optional extra. Chrome DevTools' Performance panel records interactions with all three phases broken out on the timeline, so you can see, for a specific slow click, whether the browser was stuck waiting (input delay), busy running your code (processing), or busy re-rendering (presentation). Fixing the wrong phase (say, optimising a handler when the real problem is a queue of long tasks blocking input delay) will not move your INP score at all.
What causes poor INP
A handful of patterns account for almost every bad INP score:
- Long tasks on the main thread. Any JavaScript task that runs for more than 50ms blocks input from being handled until it finishes. Big bundles, heavy hydration, and dense synchronous logic all produce these.
- Third-party scripts. Tag managers, chat widgets, A/B testing tools and ad scripts are consistently the biggest INP offenders on real sites, because they run on your main thread but are entirely outside your control, and they often fire more work in response to the same interactions your own code is handling.
- Expensive event handlers. A click handler that does too much synchronous work (recalculating a large data set, formatting a big table, running unthrottled logic) makes the processing phase the bottleneck.
- Oversized DOM. A very large or deeply nested DOM makes style recalculation and layout expensive on every interaction, not just at page load, because the browser has more to check every time something changes.
Tip
Don't guess which of these is hurting you. Crawl Cove's audits surface INP alongside a breakdown of the scripts and long tasks actually running on your pages, so you can see whether a third-party tag or your own code is the real bottleneck, rather than optimising blind.
How to fix INP, phase by phase
Break up long tasks and yield to the main thread. Splitting one large JavaScript task into smaller chunks, with a yield in between, lets the browser stop and handle a pending interaction before continuing. The modern way to do this is scheduler.yield() (with setTimeout(fn, 0) as a fallback for browsers that don't yet support it), and isInputPending() can tell a long-running task to check whether it should pause because a user has just interacted. This is the single highest-leverage fix for the input delay phase.
Defer or lazy-load third-party scripts. Load tag managers, chat widgets and A/B tools with async/defer, delay them until after the main content is interactive, or load them only when a user is likely to need them (for example, loading a chat widget only after a scroll or a click on a "help" affordance). Every third-party script you can delay is main-thread time you get back.
Move heavy work off the main thread with web workers. Computation that doesn't need direct DOM access (large data transforms, sorting, parsing) can often run in a web worker, leaving the main thread free to handle input the moment it arrives.
Debounce and throttle expensive handlers. If a handler runs on every keystroke or every scroll event, throttle it so it does the expensive work less often, and debounce anything that should only run once the user has paused.
Reduce DOM size, and use content-visibility for off-screen content. Applying content-visibility: auto to sections that are off-screen tells the browser to skip layout and paint work for them until they're needed, which shrinks the cost of every style recalculation, directly improving the presentation delay phase.
Heads up
INP cannot be truly measured in a lab. Tools like Lighthouse run once, on an empty page, with no user interacting. They can estimate responsiveness with proxy metrics like Total Blocking Time, but they cannot produce a real INP score. A true INP number only comes from field data: real users, on real devices, actually clicking and tapping. Treat lab tools as a way to diagnose a problem you already know exists from field data, not as a way to discover it.
Where to find real INP data
Because INP is fundamentally a field metric, you need a source of real-user data, not just a synthetic test:
- Chrome User Experience Report (CrUX): Google's own aggregated field data, and the source it uses for the page experience signal. This is the number that determines whether you pass or fail.
- Google Search Console: the Core Web Vitals report under Experience buckets your URLs into good, needs improvement and poor from that same CrUX data, and groups similar URLs together. It will not tell you why a page is slow, but it is the fastest way to see how many pages have an INP problem and which templates they share. For most people it is where they meet their INP score for the first time.
- Real User Monitoring (RUM): if you have enough traffic, your own RUM setup gives you INP broken down by page, device and even individual long tasks, which is far more actionable than an aggregate CrUX figure.
- PageSpeed Insights: surfaces CrUX field data for a URL alongside a Lighthouse lab run, so you get both a real INP (if the URL has enough traffic to qualify) and lab diagnostics in one place.
Crawl Cove pulls CrUX field data for any page you open in the URL Inspector, so you see your real INP at the 75th percentile alongside LCP and CLS from the same field data, with no separate RUM setup required. Run the paired Lighthouse lab check on the same page and you also get Total Blocking Time, a proxy for how much main-thread work is likely dragging INP down. The CrUX API key is free and is set once.
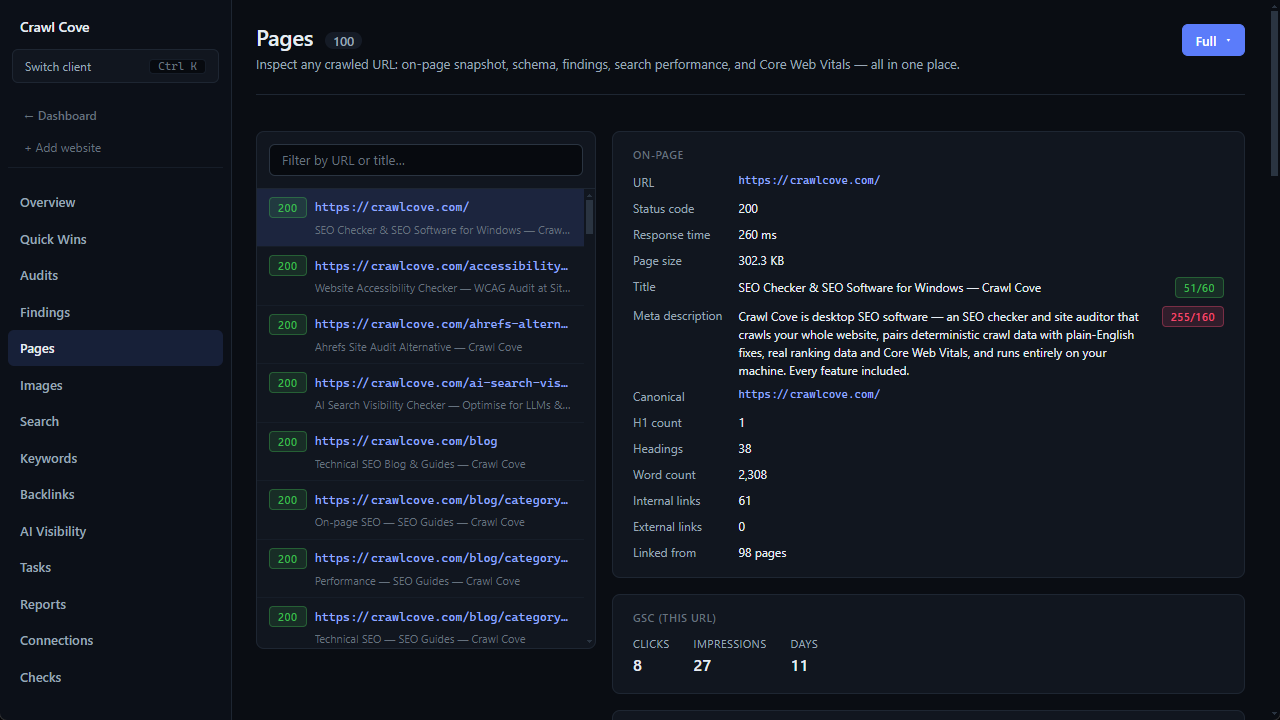
See it for a specific page in the URL Inspector guide, or check where any page stands with the Core Web Vitals checker, which also covers mobile-first indexing and layout-shift causes, since heavy interactive elements often hurt both at once.
For the authoritative technical detail beyond what's practical to cover here, Google's own INP article on web.dev is the best primary source.
Wrap-up
INP replaced FID because responsiveness is not just about the first click. It's about every interaction, for the whole visit, measured all the way through to the moment the screen actually updates. When a page fails INP, the fix starts with working out which of the three phases (input delay, processing time, or presentation delay) is actually to blame, then targeting it directly: yielding long tasks, deferring third-party scripts, moving work to workers, debouncing handlers, or trimming the DOM. None of that is guesswork if you have real field data to point at the worst pages first. See how Crawl Cove surfaces INP for any page you open in its URL Inspector, so you're fixing the actual bottleneck instead of the one you assumed.
Frequently asked questions
- What is a good INP score?
- 200 milliseconds or less at the 75th percentile of real visitors. Between 200 and 500 milliseconds needs improvement, and anything over 500 milliseconds is poor.
- Why did INP replace First Input Delay (FID)?
- FID only measured the delay before the browser started handling a user's very first interaction. INP measures the full latency (delay, processing and presentation) of interactions across the entire visit, and reports a value close to the worst one, so it catches sluggishness FID missed entirely.
- Can I measure INP with Lighthouse?
- Not a real one. INP needs actual user interactions to calculate, so Lighthouse can only simulate or estimate it. A true INP score has to come from field data such as the Chrome User Experience Report (CrUX) or your own Real User Monitoring.
- What are the three subparts of INP?
- Input delay, processing time and presentation delay. Google's documentation calls them the subparts of an interaction; "phases" means the same thing. Input delay is the wait before your handler can start, processing time is your handler running, and presentation delay is the browser painting the result.
- Where do I see INP in Google Search Console?
- In the Core Web Vitals report under Experience. It buckets your URLs into good, needs improvement and poor using the same CrUX field data Google uses for ranking, and groups them so you can see which templates share a problem.